|
Script:
RTT 3 Slopes
 Back to Catalogue Back to Catalogue
Purpose:
Draw the Gradients (slopes) of three Moving Averages. This graph displays in its own window the acceleration or slowing down of three Moving Averages - slow, medium, and fast.
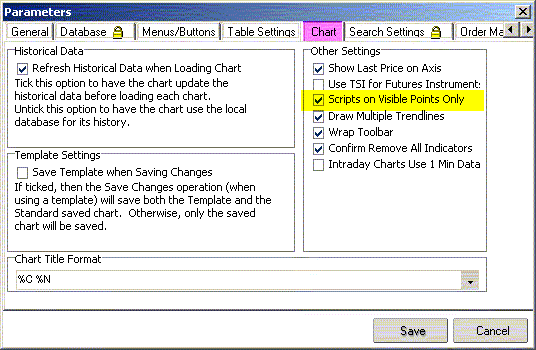
To save time, it is recommended to set the global chart parameters to "calculate visible points only". This means the script calculates and draws only for the days visible in the current window. (see "Parameters" below)
If you zoom out and wish to expand the plot, right-click inside the window, select the script's Properties, and click "OK". That will redraw the plot for the larger time frame.
Please note that plotted scripts work on any time scale. Substitute "tick" (week, hour, month...) for "day" where appropriate.
The theory says that, the steeper a Moving Average rises, the greater the likelihood of the price continuing to rise. Conversely, if a MA begins to level off or drop, chances are the price is heading down as well. Buying when the averages over long, medium, and short periods are rising, is therefore seen as safer than buying into a falling trend. "The Trend is your Friend." In addition to the above, an entry near the turn of the last (usually the shortest) MA is seen as offering the greatest rewards. "Buy Low. Sell High."
 Back to Catalogue Back to Catalogue
References:
Barry Littler on Technical Indicators
Prophet on EMA
Prophet on WMA
Investopedia on Golden Cross with links to MA Tutorials
incrediblecharts on Three Moving Averages
 Back to Catalogue Back to Catalogue
Parameters:
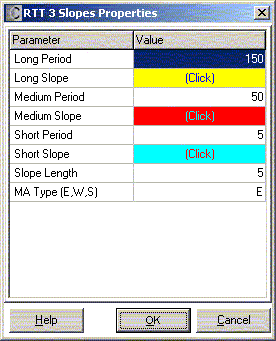
Period = period, over which MAs are calculated (Long, Medium, Short)
Note that it is your responsibility to ensure the numbers are in order Long, Medium, Short.
Each Period is drawn in its own distinctive colour, the defaults of which can be changed.
Slope Length = number of days, over which the gradient is calculated. Shorter values mean more noise, longer periods have a smoothing effect
MA Type = calculation method for the MAs: Exponential, Weighted, or Simple

Global (File) Parameter Setting for Chart to draw plotted scripts faster:

 Back to Catalogue Back to Catalogue
Example

Back to Catalogue
|


